
In this tutorial we will show you how to create a chart for a report. We'll continue to use the Crosstab Report we created in the Crosstab Report tutorial and create a chart to show the total order amount by product category.
Steps to Create a Chart
1. Open PHPMaker
Open PHPMaker and connect to the demo database.
2. Add a chart
Before creating charts, make sure you have already enabled the Chartjs extension, see Using Extensions.
To add a chart to a report, click the report in the database pane on the left, the tabbed Field Setup page and Chart Setup Page will show up on the right. Click the Charts tab to go the Chart Setup Page.
Click + button to add a new chart.
Enter chart Name (preferably alphanumerical characters only) as "OrdersByCategory"and Caption as "Orders By Category".
In this example we draw a column chart so we leave the Chart type setting unchanged at the default value - Column 2D Chart.
Under Category (X) Axis, select "CategoryName" for the Category field setting.
Under Category (Y) Axis, select "Amount" for the Value field setting.
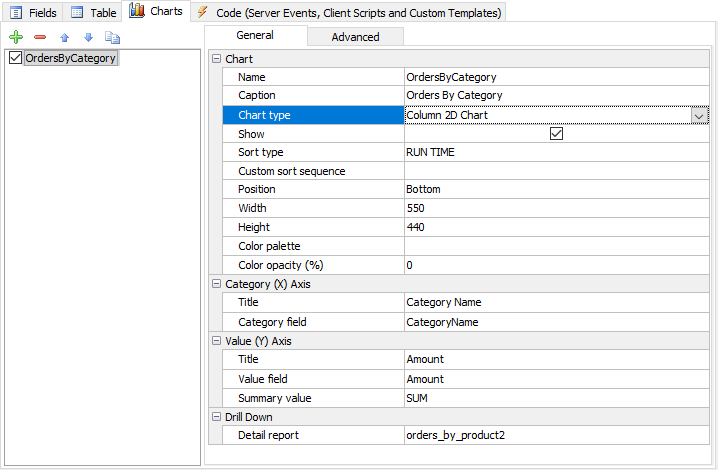
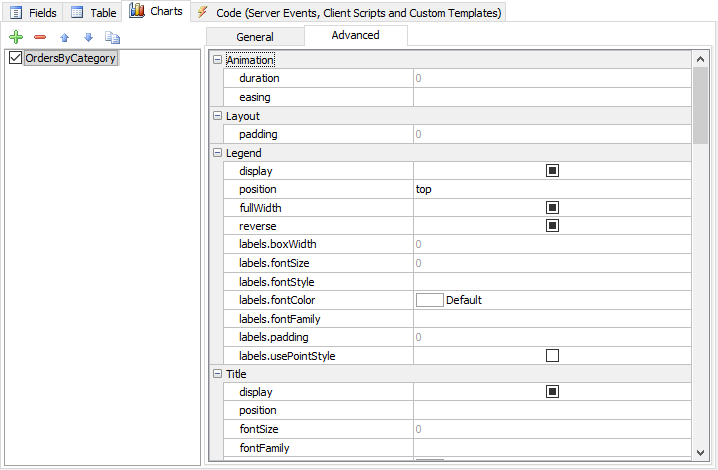
There are many other advanced chart properties for you to configure the chart, click Advanced tab to setup:
3. Generate scripts
Go to the Generate tab, click the Generate button to generate scripts.
4. Run the application
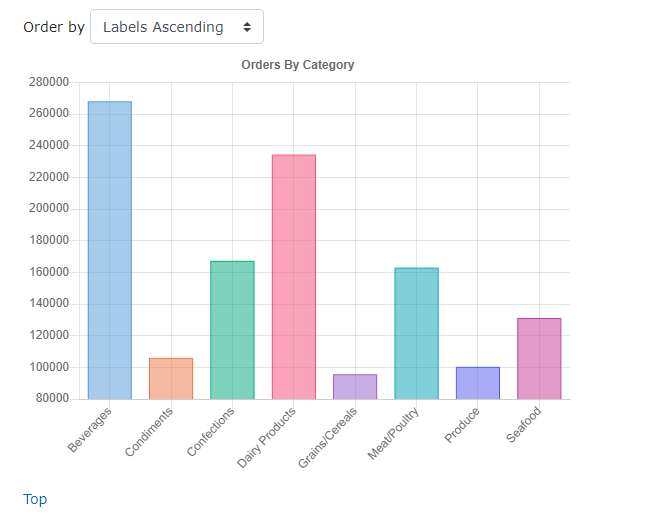
Click the "Reports" menu button and select "Quarterly Orders by Product" (or select the sub-menu "Orders By Category") to run the report and see the chart.
Also See