
PHPMaker supports JavaScript charting by Chart.js.
After loading the database, the database objects (tables, views, custom views and reports) will be shown in the left pane (the database pane). Click on any database object to go to the Chart Setup Page for that object at any time. The Chart Setup Page is next to the Field Setup page, if the active page is Field Setup Page, click the Chart tab to switch to the Chart Setup Page.
The Chart Setup pages consists of two section. The left section is a list showing all charts for the report. The right section is a panel showing various properties of the selected chart.
In the left section, the toolbar has the following buttons:
| Add a new chart | |
| Remove selected chart | |
| Move the selected chart up. The sequence determines the displaying order of the charts in the generated script and in the menu. | |
| Move the selected chart down. The sequence determines the displaying order of the charts in the generated script and in the menu. | |
| Duplicate the selected chart as a new chart and copy the chart properties. Since each chart has many properties, this feature enables you to create a new chart faster. |
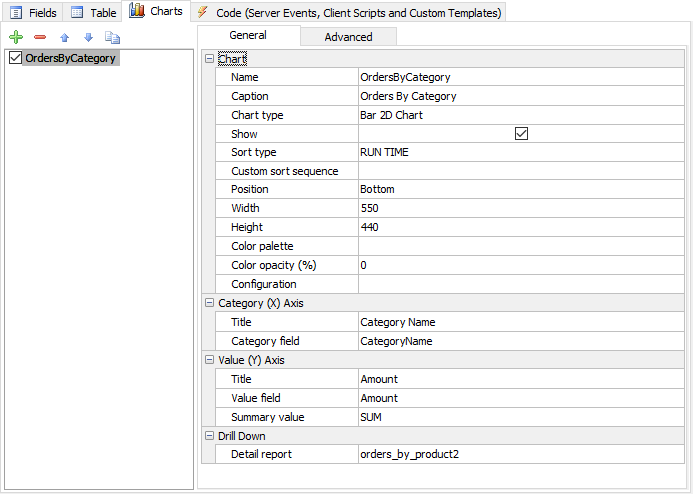
To setup chart properties, select a chart in the left section first, then you can modify its properties in the right panel.
General
| Name | The name of the chart. This is also internal ID of the chart for referencing the chart by code, use alphanumerical characters only (e.g. "MyChartName"), also make sure the chart names are unique. |
| Caption | The caption of the chart. This is the caption to be displayed on the chart. |
| Chart type | The type of the chart. Supported charts types are:
|
| Show | Show or hide the chart in the report page. |
| Sort Type | Specifies how to sort the data for charting. Possible values are:
|
| Custom sort sequence | Custom sort the data for charting. You can enter comma separated values, e.g. if Sort Type is X ASC or X DESC, the chart is sorted by category labels, then you can enter your custom order by: (no spaces after commas)
label1,label2,label3,... If the labels contain comma, you can enter an array, e.g. ["label1", "label2", "label3", ...] |
| Position | The position of the chart in the report. Possible values are:
|
| Width | Width of the total area of the chart. Default is 600 (pixels). |
| Height | Height of the total area of the chart. Default is 500 (pixels). |
| Color palette |
Specify colors of the data points. You can customize your own color palette by clicking [...] button and change the colors.
If unspecified, the advanced setting [Chart color palette]([tools.html?id=chart-color-palette-1) will be used.
If **Chart color palette** unspecified, the [Chart.js default color palette](https://www.chartjs.org/docs/latest/general/colors.html#default-color-palette) will be used.
|
| Color opacity (%) | Opacity of the data point. 100% is opaque. Default value of 50 will be used if not specified. |
| Configuration | Additional chart configuration. You can add more configuration to the chart. This setting must be in JSON syntax, e.g. { options: { ... } }
Note You can also add chart configuration by JavaScript, see examples below. However, use either way only, or one will overwrite the other. |
Category (X) Axis |
|
| Title | X-axis (category) title. Displays the category of the plotted data. |
| Category field | The field that contains the categories of the chart. |
| Value (Y) Axis | |
| Title | Y-axis (value) title. Displays a description for the scale of values against which the data is plotted. |
| Title 2 | Secondary Y-axis (value) title 2. For use with multi-Series dual Y axis charts only. |
| Value field | The field that contains the values of the chart |
| Summary value | Summary value of the chart, by default it is same as the summary value of the field. Supported values are:
|
Series |
|
| Series type | Specify how the series are defined. Possible values are:
|
| Series field | Specify the field that contains the series name when Series type is set as Series field. |
| Series fields | Specify the field names of each series when Series type is set as Series per field. Click the [...] button to open the setup from and select the column for each series. |
Drill Down |
|
| Detail report | You can drill down the chart values (Y Axis) by setting up a detail report.
To setup a detail report, click the [...] button to open the Drill Down setup form. Select a report as detail report, then select the parameters. Select Source Field from the current report and Target Field from the detail report. The report will then build hyperlinks for the field values to pass the selected field values from the current report to the detail report. To make the detail report shows meaningful details, you need to pass the required parameters from the current report to the detail report. Select the field values you need to pass, make sure they are sufficient for selecting the relevant records in the detail report.
Notes
Setting up of detail report for chart is exactly same as setting up detail report for reports, see Tutorial - Drill Down Report. If you want to drill down to another chart directly, you can create a report and disable the Show Report option, see Table Setup. |
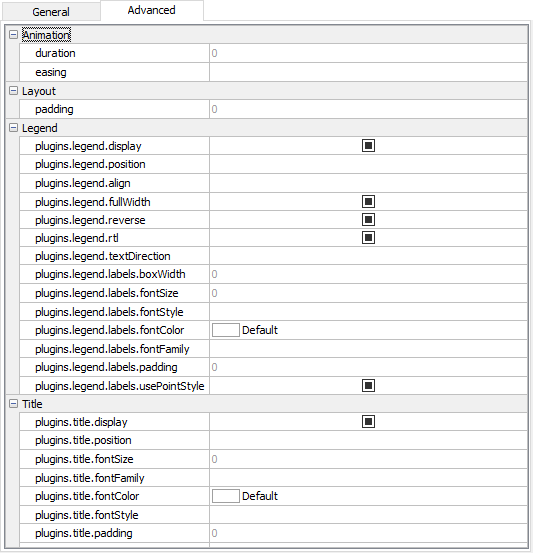
Advanced
There are many other advanced chart properties for configuring the chart. Select your chart and click the Advanced tab to setup.
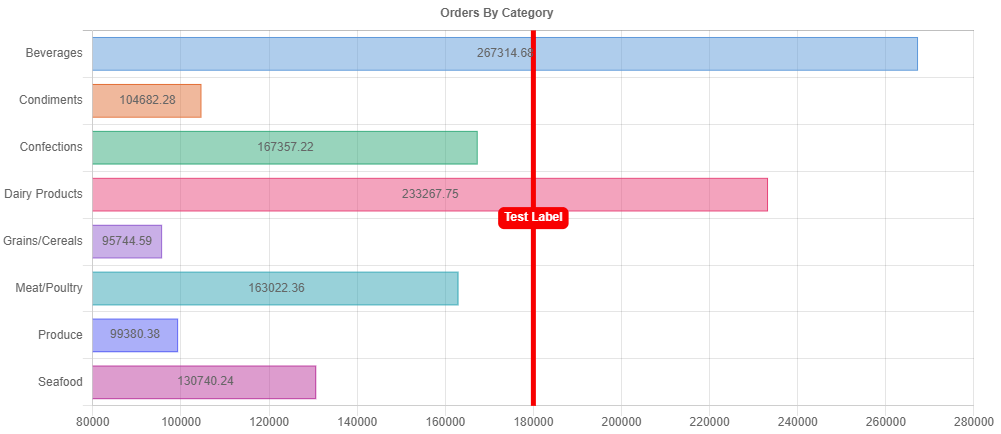
Line Annotations
From v2021 PHPMaker supports trend lines by using Line Annotations of chartjs-plugin-annotation. In the Advanced tab, scroll to the bottom, you can enter up to 4 trend lines:
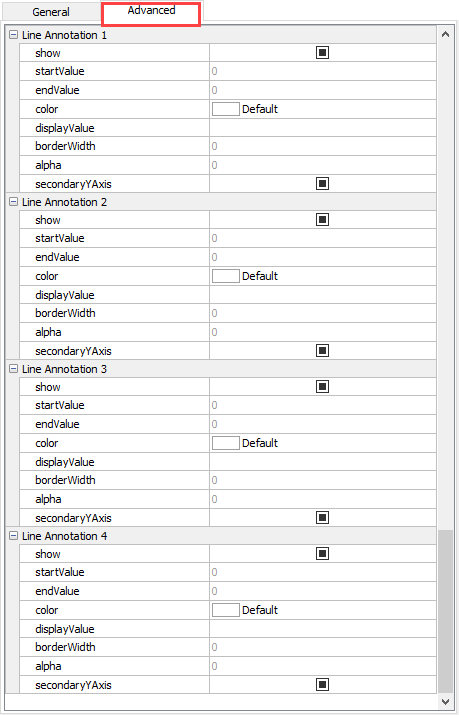
Each trend line has the following settings:
| show | Show the line |
| startValue | Data value to draw the line at |
| endValue | Optional value at which the line draw should end |
| color | Line color and background color of label |
| displayValue | Text to display in label |
| borderWidth | Line width |
| alpha | Alpha of line color and background color of label |
| secondaryYAxis | Line is for secondary Y-Axis |
Server Events and Client Scripts
Chart.js and chartjs-plugin-annotation.js support various settings and events, see Chart.js Configuration and chartjs-plugin-annotation for details.
To further configure a chart, you can use the Chart_Rendered server event or JavaScript. Since Chart.js is JavaScript, it might be easier to use Client Script of the page.
Example 1 - Add chart configuration by "chart" event.
Example 2 - Add chart configuration by ew.charts.
Advanced Settings
You can also set the following under Advanced Settings
Also See
Tutorial - Chart
Tutorial - Drill Down Report