In this tutorial we will show you how to create a drill down report and chart in PHPMaker. We will use the demo database for demonstration.
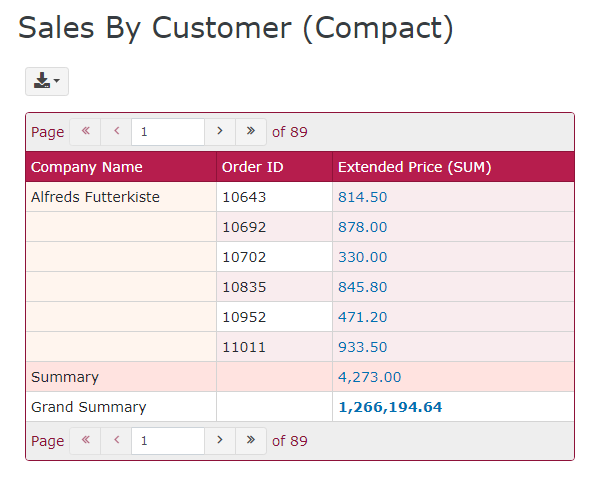
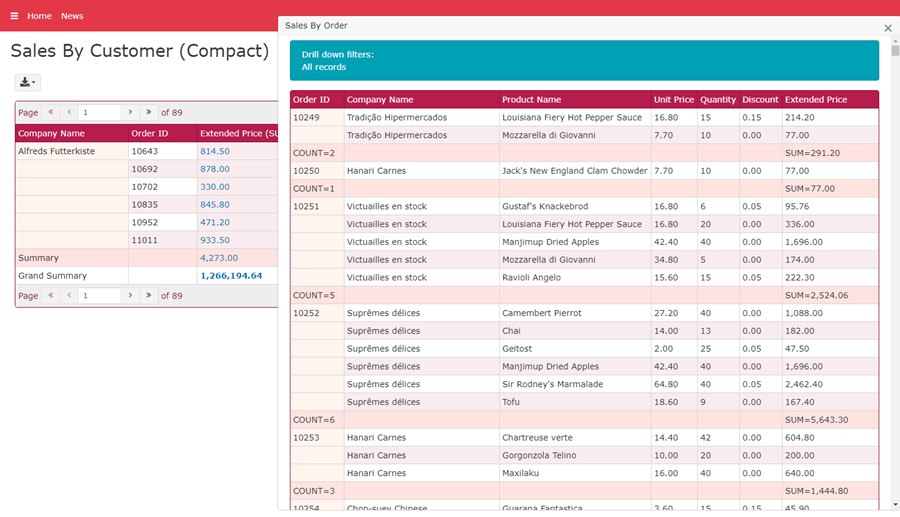
We will continue to use the summary report created in Tutorial - Summary Report. If you have not yet created the summary report, refer to the tutorial and create it first. Note that we use the compact report:
Above report does not show the order details in each order. Now we create a detail report so user can click the sum of Extended Price (the last column) to see the order details of each company or each order.
Steps to Create the drill down eport
1. Open PHPMaker
Open PHPMaker and connect to the demo database.
2. Add a Detail Report (if not already exists)
In this example, we can simply use the source view "order_details_extended" or even the report "Sales by Customer" itself as detail report, both contains data we want to show in the detail report. However, "order_details_extended" does not have grouping fields so we cannot group the records by order ID. The report "Sales by Customer" itself has an extra grouping level (Company Name) that we do not need to show in the detail report. So we'll create a new report as detail report.
Right click Reports on the database pane then click Add Summary Report, or click Edit in the main menu and then select Add Summary Report.
Following the same steps in Tutorial - Summary Report, name it as "Sales by Order".
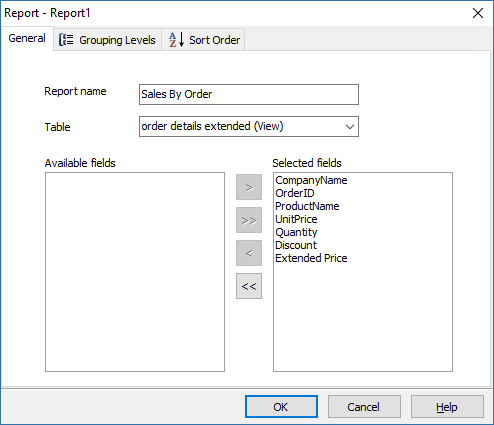
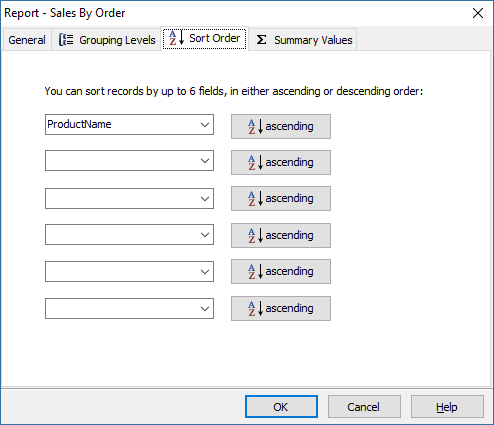
Note that this time we only use one grouping level as we do not need to show the company name:
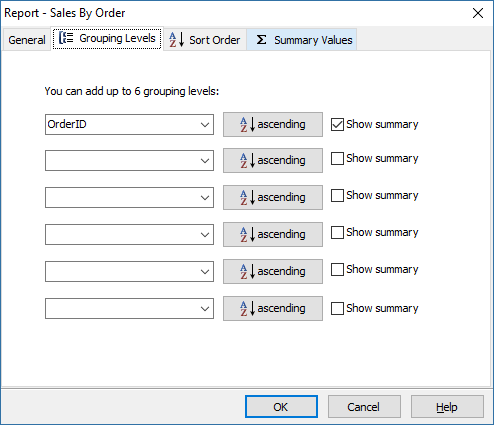
We want to see details of each order item, so check Details and summary. We also enable Show grand summary because we want to know the total price and average quantity of order item for all orders.
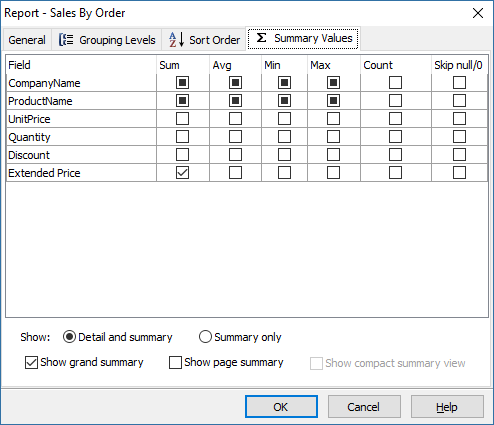
Click OK to finish.
3. Set up drill down report
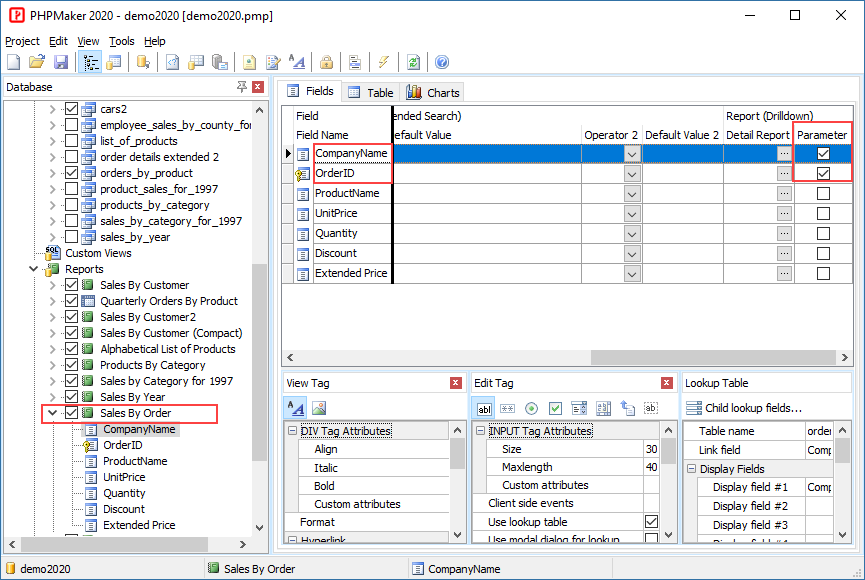
Now click the main report in database pane to select it, the fields will be shown in the right pane. Select the "Extended Price" field (for which we want to create the hyperlinks to r drill down), scroll to right and find the Detail Report column under Drill Down section:
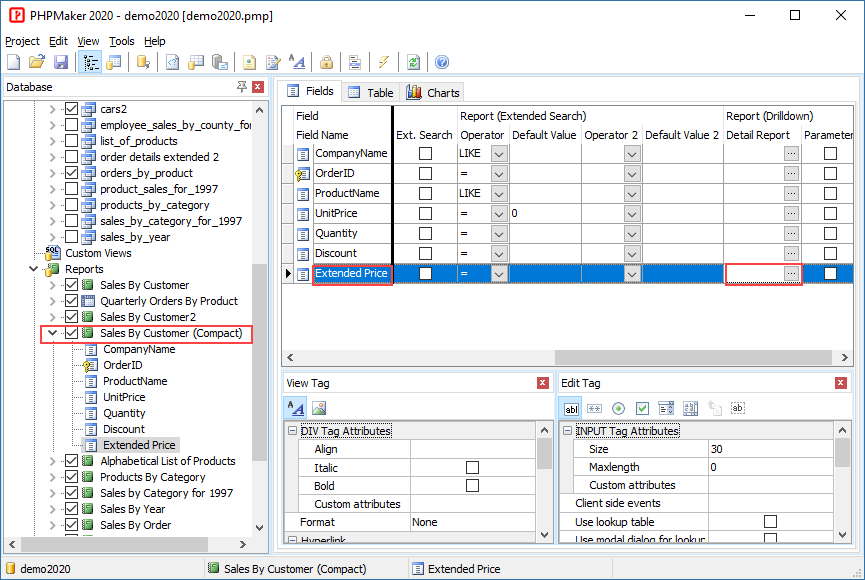
click the ... button to open the Drill Down setup form, select the just created report "Sales by Order" as detail report. To enable the detail report to show order details, we need to pass the "CompnayName" and "OrderID" field values from the main report to the detail report, so we map the field as follows:
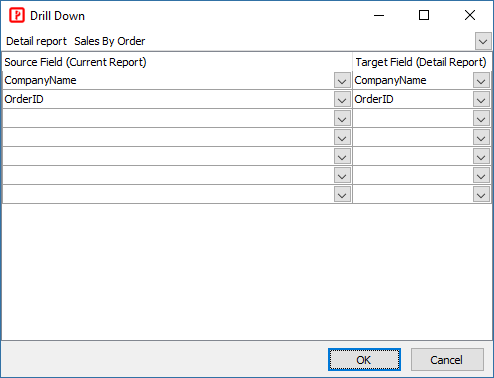
Click OK to finish.
If you now click the detail report and inspect the Parameter column, you'll see that PHPMaker has setup the target fields as parameters:
4. Generate scripts
Go to the Generate tab, click the Generate button to generate scripts.
5. Run the application
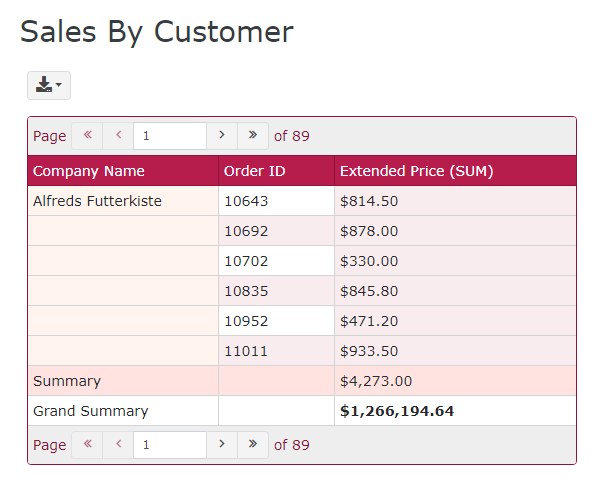
Browse the generated site, go to "Sales by Customer (Compact)" report to see the result. Note that now the "Extended Price (SUM)" values have hyperlinks:
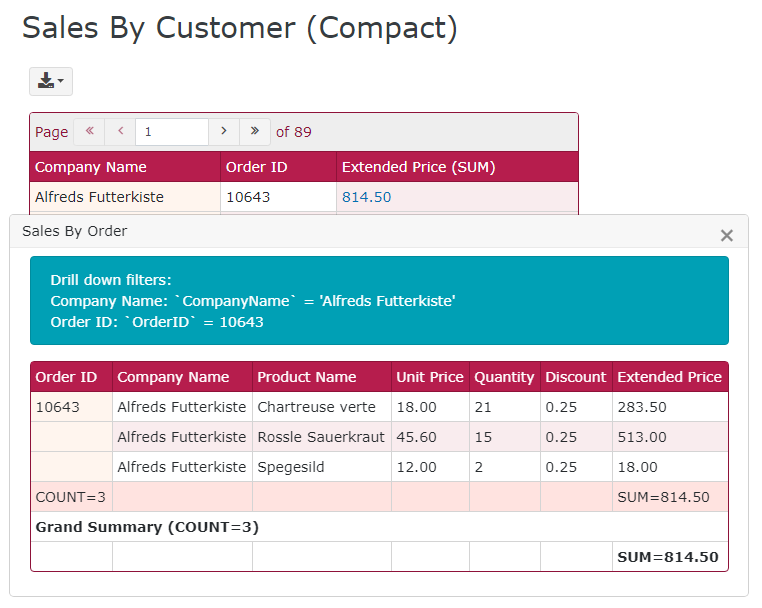
Click the "Extended Price (SUM)" for each Order ID, you'll see the order details:
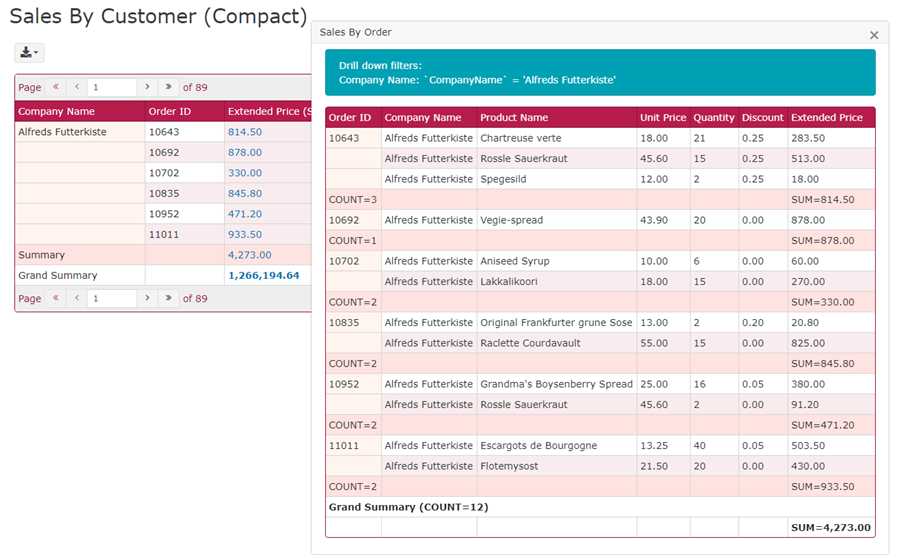
Click the "Extended Price (SUM)" for each customer, you'll see the order details of each order of the customer:
Click the Grand Total of "Extended Price (SUM)", you'll see all the order details:
Advanced Settings for Drill Down
Note that there are two advanced settings for drill down:
Server Event and Client Scripts
If you enable **Use popover for drill down**, you can customize the popover's options (see [Popover Options](https://getbootstrap.com/docs/5.3/components/popovers/#options)) by setting the ``data-config`` attributes of the drill down link with server events or client scripts.
**Example**
Set attributes of drill down links.
Drill Down for Charts
You can also drill down the chart values (Y Axis) by setting up a detail report, see Chart Setup. Setting up of detail report for chart is exactly same as setting up detail report for reports.
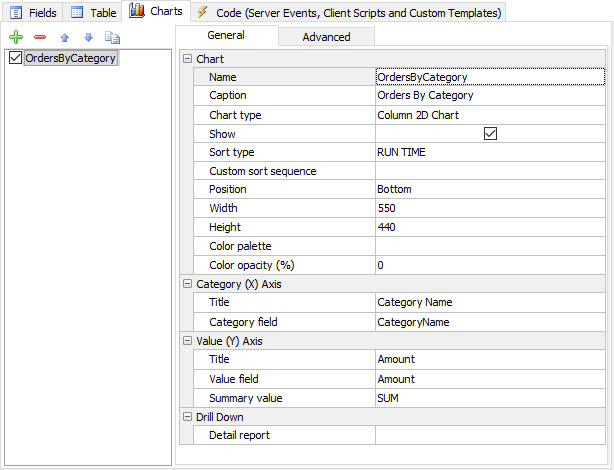
For example, we add a chart for the crosstab report Quarterly Orders by Product we created in the tutorial Tutorial - Crosstab Report as following:
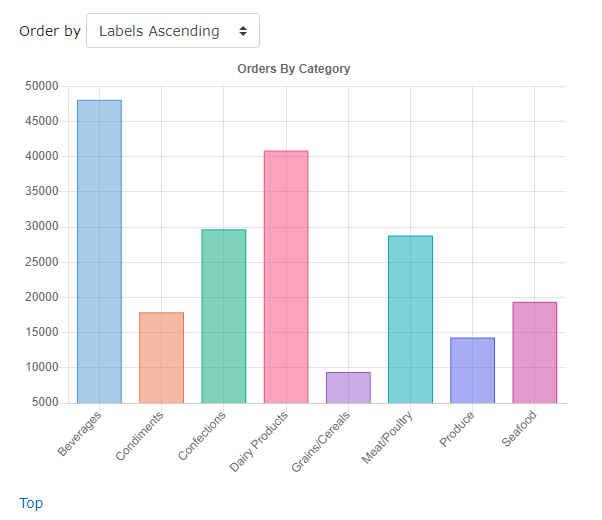
The generated chart will be like:
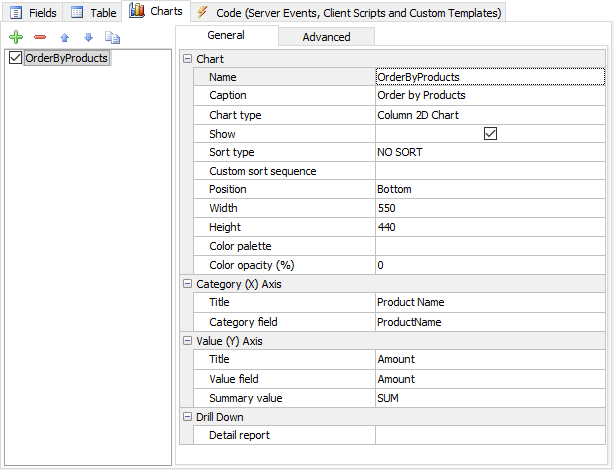
Now we create another chart as a drill down chart. To create a chart, we need to create a report first. We create a new summary report from the view of the report, orders_by_product, and name the new report orders_by_product2, select all fields. We can leave the Grouping Levels and Sort Order empty. Then we create a chart for it as follows:
To drill down to the chart only without showing the report, we disable the Show Report option for the view, see Table Setup.
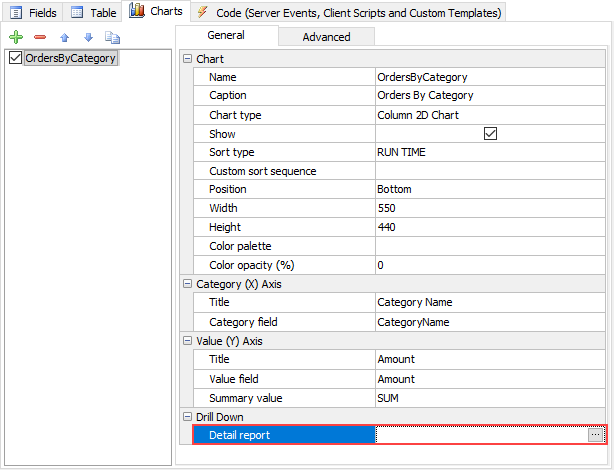
Then we can go back to the Chart Setup page for the crosstab report Quarterly Orders by Product to setup the drill down, click the [...] button of the Detail report row:
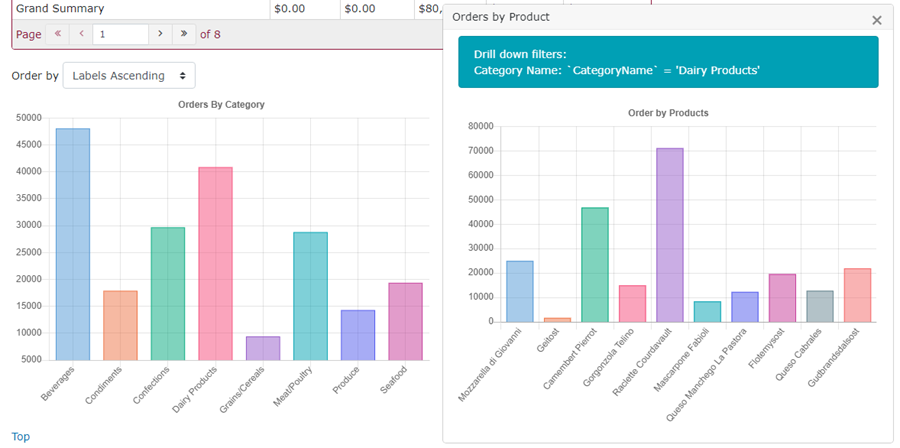
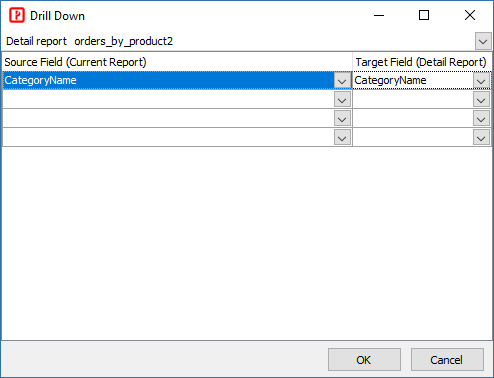
The Drill Down setup form will be displayed. We select the view orders_by_product as detail report and we pass the Category (X) Axis value, in this example, category name, to the detail report:
Generate scripts again, click the bars in the chart under the crosstab report Quarterly Orders by Product and you'll see the drill down chart: