
In this tutorial we will show you how to create a Crosstab Report. We will use the demo database for demonstration.
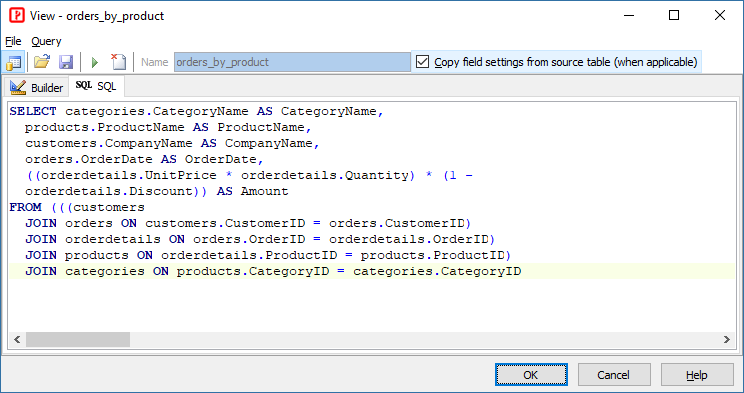
As explained in Preparing Your Data for Reports, PHPMaker creates reports from a single table, if you need data from more than one table, you should create a view in your database first.
In this example, we use the view "orders by products" to generate a crosstab report that shows quarterly sales by product for different years.
Steps to Create the report
1. Open PHPMaker
Open PHPMaker and connect to the demo database.
2. Add a Crosstab report
Right click Reports on the database pane then click Add Crosstab Report, or click Edit in the main menu and then select Add Crosstab Report.
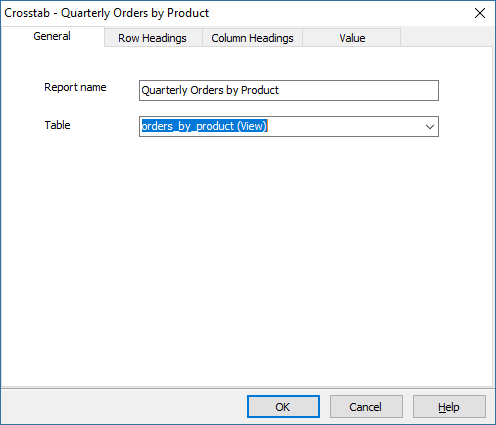
The Crosstab Report Setup form will show up, enter the report name, for example, we use "Quarterly Orders by Product". Select the View "Orders By Products" as source table.
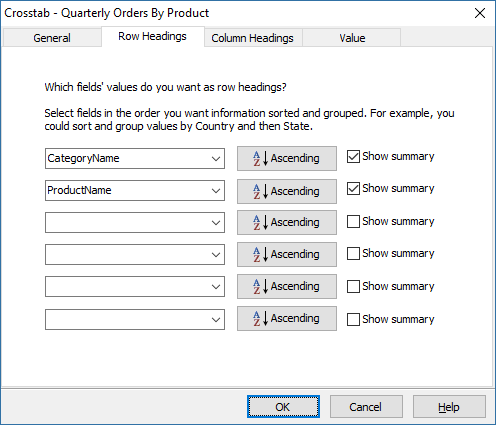
Click the Row Headings tab, since we want to group the order items by category name and then by product name, we select "CategoryName" and then "ProductName" as row headings. We also want to see the summary for each category so we check the Show summary checkbox for the field "CategoryName".
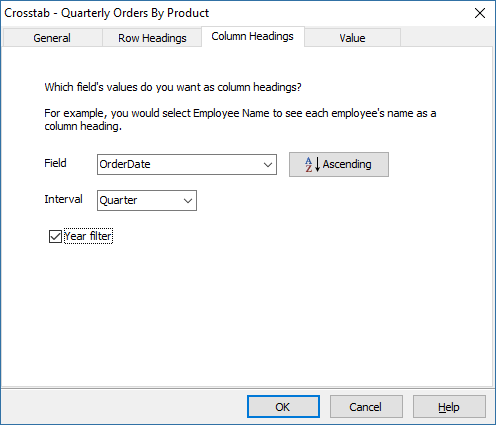
Click the Column Headings tab, since we show the order date (quarterly) as column headings, we select "OrderDate" as Field and select "Quarter" as Interval.
When we prepare the data by creating the view, we can filter the orders to a particular year by using a WHERE clause, in that case, the report will be for that particular year only.
In this example, however, we did not filter the data in the view, the data includes orders for more than one years. If your group by "Quarter", orders in the same quarter but different years will be grouped together. That is usually not what you want, so we enable the Year filter feature, PHPMaker can create a combobox of the years according to the data and display data for a year at a time.
Now click the Value tab. We want to see the total order amount by product, so we select "Amount" as the Field and select "SUM" as Summary value.
Click Include row sums to let the report calculation sum of the each row, that is, the total amount of the quarters.
Since there are quite a few products, the report will not be displayed in one single page (depends on the Record per page setting), we select Show page summary to make the report show the summary of the orders displayed in the current page only. Moreover, we check Show grand summary so we'll always see the summary of all orders too.
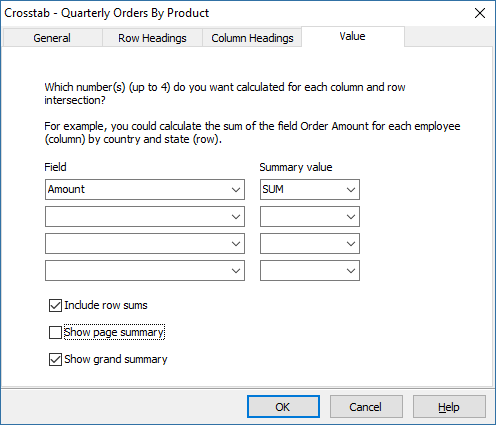
Click OK to finish.
The report will be added in database pane. Field level setup will be copied from the source table.
3. Generate scripts
Go to the Generate tab, click the Generate button to generate scripts.
4. Run the application
Browse the generated site, click "Quarterly Orders by Product" in the menu to run the report. Note that:
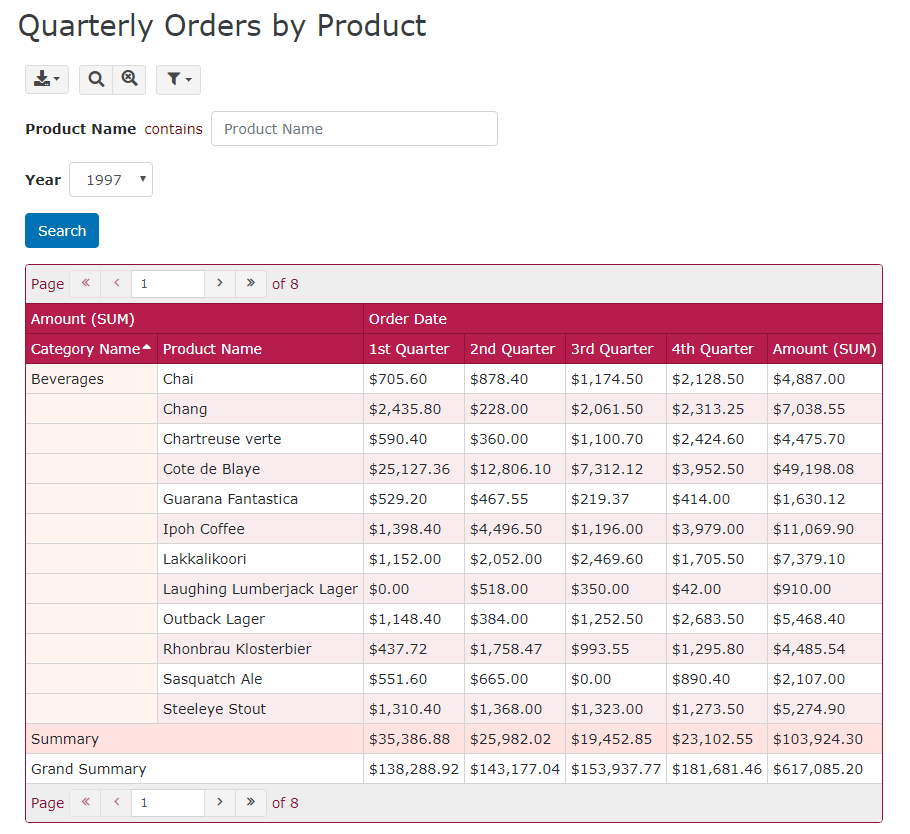
Also See