
A report is created from one existing table or view. If you need to display data from more than one table or view, join them first using a view in your database, see Preparing Your Data for Reports.
After loading the database, the database objects (tables, views, custom views and reports) will be shown in the left pane (the database pane). To create a report, right click the database pane and select Add Crosstab Report. Alternatively, you can click Edit in the main menu and then select Add Crosstab Report.
The Crosstab Report Setup window will show up:
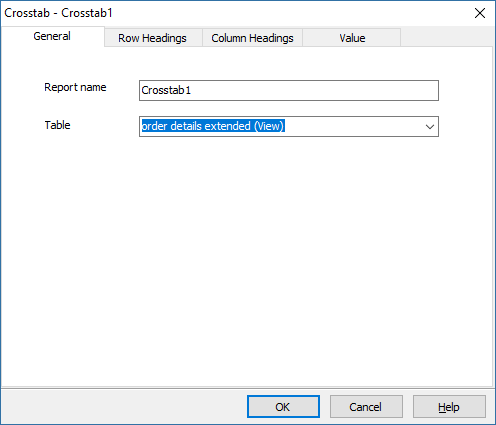
The Crosstab Report Setup window has 4 tabs. Go through these tabs one by one to setup your report.
General
PHPMaker will give the new report a temporary name, Crosstab<n>, where n is an integer. If you want to change the name, enter a new name in the Report name edit box. Then you can select a table or a view from the Table combobox.
Settings in this tab are mandatory.
Row Headings
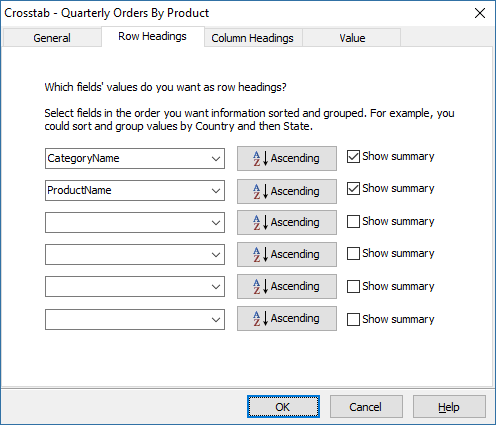
Select the fields that you want to be displayed as row headings. You can optionally select up to 6 fields. Select fields in the order you want the data to be grouped and displayed. For example, you could sort and group values by Country and then State.
You can sort the values of the row heading fields in either ascending or descending order. After selecting the fields, press the buttons next to the comboboxes to change the sort order.
Check Show summary if you want to show sumary for each group.
Column Headings
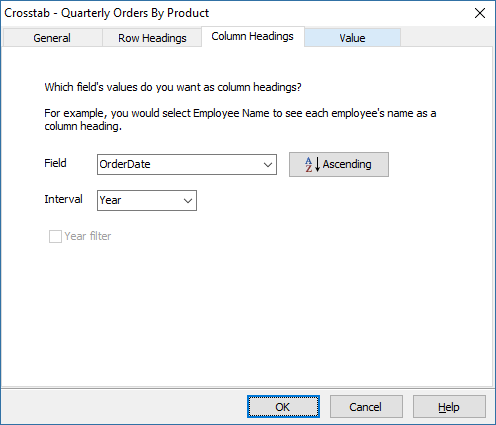
Select the field in which distinct values from the field will be used as column headings. For example, you would select Employee Name to see each employee's name as a column heading.
You can sort the values of the column heading field in either ascending or descending order. After selecting the fields, press the buttons next to the comboboxes to change the sort order.
If the field is of date/time type, the Grouping Interval property sets the interval for the field values, possible value are:
If the field is of date/time type, and the Grouping Interval is Quarter or Month, the Year filter setting become available. If unchecked, quarters or months of different year in the report will be displayed together. If checked, a combobox for the available years will be added automatically to the report so user can select which year's data to display.
Value
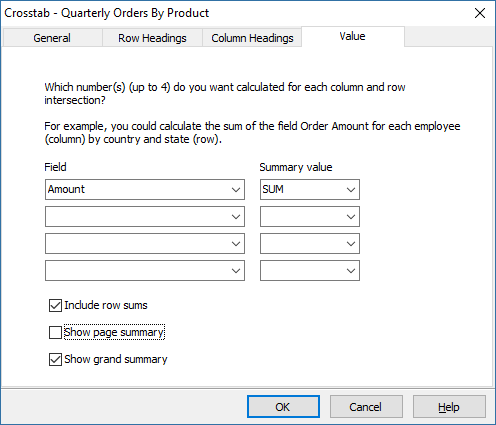
Select the Field and the Summary value that you want to calculate for each column and row intersection. For example, you could calculate the sum of the field Order Amount for each employee (column) by country and state (row). Possible values of summary value are:
If you want to include sums for each row, select Includes row sums for the report.
You can choose up to 4 summary values.
Finally, you can choose to Show page summary and/or Show grand summary for all records at the end of the report. If Show page summary is enabled, the summary for the records in the current page will be displayed at the end of the page. If Show grand summary is enabled, the summary for all the records in the report will be displayed at the end of the page. These options are enabled by default.
Press OK to finish setup. When a report is created, the field settings will be copied from the source table. But from then on, the report has its own field settings and is much like other table in PHPMaker.
To edit a report, right click the report in the database pane and select Edit Report. Alternatively, you can select the report first, then click Edit in the main menu and then select Edit Report. Note that the source table of a report cannot be changed.
Also See
Security Setup
Tutorial - Crosstab Report