
A Dashboard report allows you select any reports and charts you have created in your project and show them in one single Dashboard report page, with links (for charts only) to the original reports.
After loading the database, the database objects (tables, views, Custom Views and reports) will be shown in the left pane (the database pane). To create a report, right click the database pane and select Add Dashboard Report. Alternatively, you can click Edit in the main menu and then select Add Dashboard Report.
The Dashboard Report Setup form will show up:
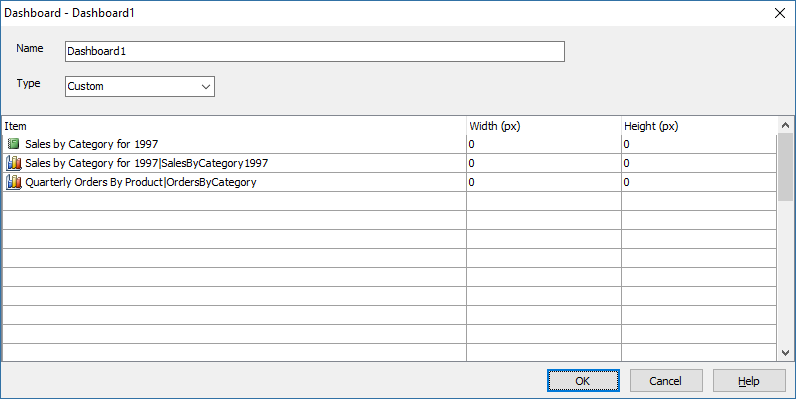
| Name | Name of the Dashboard report |
| Type | Type of the report. Possible values are:
|
| Item | Report or chart (from other reports) to be included in the Dashboard report |
| Width (px) | Min-width of the item container (pixels) in the Dashboard report. |
| Height (px) | Min-height of the item container (pixels) in the Dashboard report. |
Press OK to finish setup. The Dashboard report will appear under Reports in the Database pane on the left.
To edit a report, right click the report in the database pane and select Edit Report. Alternatively, you can select the report first, then click Edit in the main menu and then select Edit Report.
If you have selected Custom as the report type, you must provide a Custom Template. Select the Dashboard report in the Database pane, you'll see the Code (Server Events, Client Scripts and Templates) tab on the right.
Select Custom Template > Table-Specific > Dashboard -> CustomTemplate and enter your HTML as the template of the Dashboard report page.
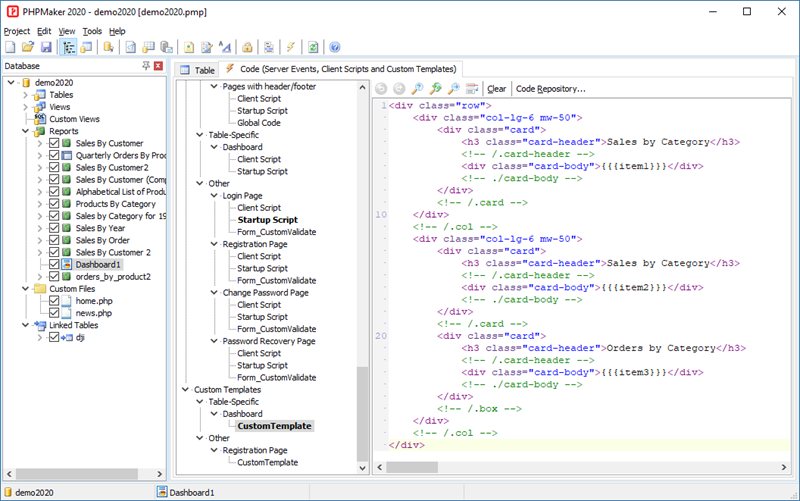
Custom Template is HTML, if you want to embed PHP code, you need to use <?php and ?> to enclose your code, if you want to use JavaScript, you need to use <script> and </script>.
Use {{{item<n>}}} to denote the nth item (report or chart) in your dashboard report where <n> is an integer, e.g. item1, item2, item3, etc.. There is no spaces between "item" and "<n>".
During script generation, {{{item<n>}}} will be replaced by the actual report or chart. See Tutorial - Dashboard Report for a real example.
Query Builder for Dashboard Report (v2024+)
To set up Query Builder for a dashboard report, please perform the following steps:
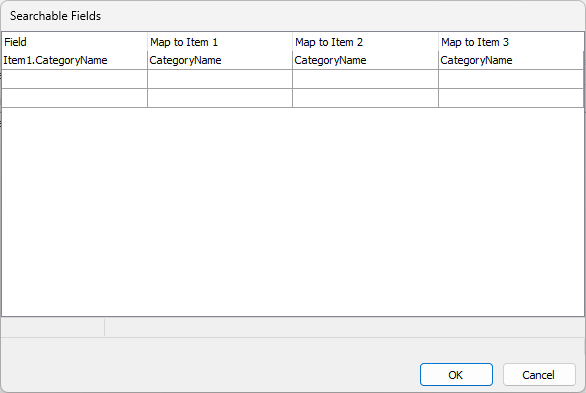
Right click on the Dashboard Report, and click Searchable Fields. The popup for the list of Searchable Fields and Dashboard Items will be displayed:
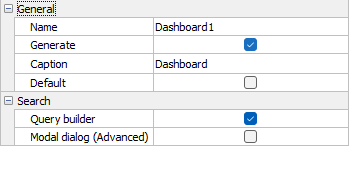
In the Table Options for the Dashboard Report, enable the Query Builder option, and optionally the Modal dialog (Advanced) option if you want the Query Builder to be a modal popup.
Also See